
How Smartlytics VIS Works

Select Your Plan
Select a price plan that meets your needs

Connect to your data
Allow Smartlytics VIS to pull data from your accounts

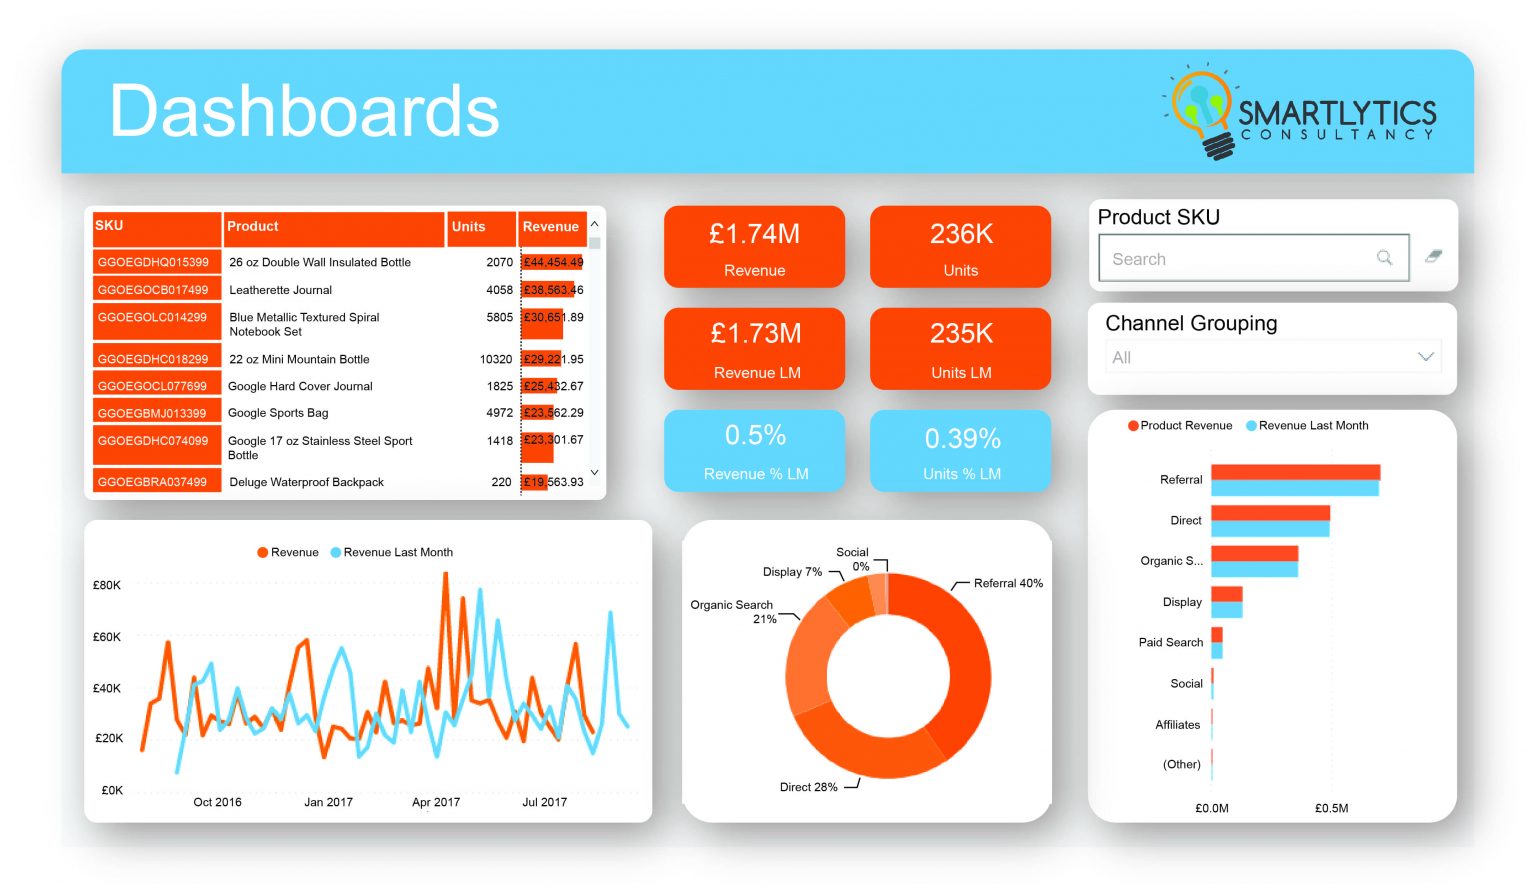
Bespoke Dashboard
Provide direction for you developer on the metrics, colors and design.

Approve
Request any edits and approve your final designs
Live Dashboard
Your dashboard is live and ready to use with scheduled data refreshes

Data Visualization Challenges We Solve
- Buying and setting up a data visualisation tool
- Buying separate connectors to pull data from different sources
- Setting up a database to host the data before visualising for better performance and scalability.
- Hiring a dashboard designer/developer to build the dashboard or spending hours and days learning how to build one.
- Ongoing maintenance to fix problems and data update issues.
Select Your Plan
SMART VIS
£75
month
- Bespoke Design
- Up to 5 Dashboards
- Up to 3 Users
- Daily Data Refresh
- Email Support
Support Data Sources:
- Excel
- Facebook Ads
- Facebook Insights
- Google Analytics
- Google Ads
- LinkedIn Ads
- LinkedIn Pages
- Twitter Ads
- YouTube
- Mailchimp
SMART VIS +
£199
month
- Bespoke Design
- Up to 12 Dashboards
- Up to 10 Users
- Daily Data Refresh
- Email Support
Supported Data Sources:
Everything in SMART VIS and
- Hubspot
- Salesforce
- Dynamics 365
- Search Console
- Opimizely
- Outbrain Amplify
- SEMrush Analytics
- Shopify
- Stripe
- Taboola
SMART VIS Platinum
£999
month
- Bespoke Design
- Up to 50 Dashboards
- Unlimited Users
- Daily Data Refresh
- Email and Phone Support
Supported Data Sources:
Everything in SMART VIS + and
- Sharepoint Folders
- SharePoint List
- Smartsheet
- Google Big Query
- Amazon Redshift
- Azure SQL
- SQL Server Database
- Azure Blobs
- Azure Data Lake
- SAP BW Application
- SAP BW Message
- SAP Hana Database
- IBM Db2
- Teradata Database
- Spark
Frequently Asked Questions
Why should I use Smartlytics VIS over other products?
Simply, because we didn’t reinvent the wheel. We’ve combined the best into one platform.
Smartlytics VIS is built on top of Microsoft Power BI embedded, connects to your data using API’s and you don’t need to worry about building the dashboard as an experienced developer builds your own bespoke dashboard as per your requirements.
The equivalent to Smartlytics VIS would be:
- Buying a tool such as Power BI or Tableau
- Buying connectors to connect to various data sources not supported by default
- Setting up a database to store your data to ensure scalability and better performance
- Hiring a freelancer, contractor or agency to build your dashboards or wasting valuable internal time trying to build the dashboard internally.
- Regularly maintaining your dashboard and troubleshooting data import issues.We’ve simply combined all this for one monthly cost starting at only £75/month.
How does it work?
- Signup to your preferred package.
- Schedule a one to one web conference with your visualisation consultant using the ‘book a meeting’ under your account
- A talented data visualisation consultant will help you connect Smartlytics VIS to your data sources and gather your dashboard requirements e.g. key metrics you want to see on the dashboard, charts, branding, colors, etc.
- 3 days later your bespoke dashboard will be ready. You can request any changes needed, which will be ready within 24 hours.
- Once approved your dashboard will be live.
- Every month you can request up to fives new changes/modifications to your dashboards as part of your subscription.
Do you offer a money back guarantee?
Yes. We offer a full refund within the first 14 days of your subscription, if you’re not satisfied with our solution.
Can I get a bespoke plan to better match my needs?
Yes. Feel free to contact us to discuss a tailored plan to better meet your requirements.